Water Demand Viewer: a New Tool for Dutch Water Authorities
The soil should be neither too wet nor too dry. Managing and overseeing this process is the responsibility of the Dutch water authorities. These past three years, however, this has proven to be a difficult task as a result of climate change and the ground drying out. The Water Demand Viewer uses satellite data to help, starting with the land used by farmers.
If their fields are too dry, can't farmers simply irrigate them? Can't the water authority just open a few weirs? Unfortunately, it is not quite that easy. A good water level for a farmer is not necessarily a good water level for other users in the area (nature management, recreation, housing development, etcetera). Furthermore, water must be used sparingly during periods of drought. A water authority must take everyone's interests into account.
In order to take the right measures at the right time, the first thing they need is an insight into what exactly is happening. For that reason, a Water Demand 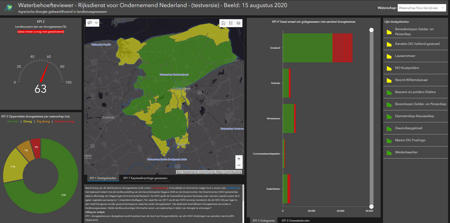
The water demand around Groningen on August 15, 2020
Viewer was developed at the request of the Dutch Ministry of Agriculture, Nature and Food Quality. Last summer, several water authorities that were part of the test phase could use their computer systems to determine what crops had a growth rate that was more than 10% lower than that of the baseline year of 2017. This information was available per area and per period. Project leader Wilmer Woudwijk, who works at the Netherlands Enterprise Agency (RVO), explains: "The Water Demand Viewer supports water-management decisions that affect the agricultural sector, such as irrigation bans. It will also make the discussions between provinces, water authorities and the sector more effective."
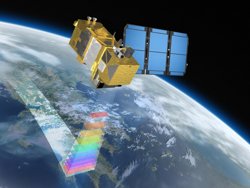
The water demand viewer makes use of data of Sentinel 2 (image: ESA)
Components
The Water Demand Viewer consists of different components. Firstly, there is a computational model that was developed by Woudwijk and his colleagues. They receive input from various data sources. RVO, for example, has a database with information regarding the types of crops that each farmer grows. Those data are necessary because not all crops need the same amount of water to grow well. Wageningen University & Research has developed a Green Index that specifies the 'normal' growth rate of different types of crops. The European space programme Copernicus contributes up-to-date satellite imagery (Sentinel-2) that is used to assess the density of greenery on a piece of land. It works perfectly because healthy plants reflect sunlight differently than vegetation affected by drought. All these components are brought together in the computational model. A dashboard then shows the water authority how the crops in the region are currently doing, compared (in percentages) to the normal situation. The professional term used is the Normalized Difference Vegetation Index (NDVI).
"We are making excellent use of earth observation data - and for more than just maps," says Joost van Uum, programme coordinator at the Netherlands Space Office (NSO), which successfully stimulates the use of satellite data in the Netherlands. "As a source of information, it is fully integrated and works behind the scenes to support one of the water authorities' daily work processes." To realise this, the NSO supported the developers during the early stages with technical advice.
New functionalities
This winter, the monitor's functionality will be further expanded to meet the water authorities' need for information even more effectively. One example is a function that provides insight into the moisture level of the topsoil (see also our article on Owasis). It provides more assurance about whether a poor growth rate is truly attributable to drought or if there are other causes, such as mice. "It also increases the reliability of the drought data for each location," Wilmer Woudwijk notes.
Other applications for the Water Demand Viewer are being developed as well, such as monitoring dykes and supporting inland navigation. On top of that, the calculation method used is becoming gradually more accurate. Farmers report their observations to the RVO so that they can be compared to the computer-generated data. The RVO does not deem it responsible to represent the drought data on a more detailed scale until the computational model has been fully optimised.
The Water Demand Viewer was developed by order of the Ministry of Agriculture, Nature & Food Quality. Since 2018, concept and model development and project management are in the hands of the RVO. The NSO expedited the project's startup phase, e.g. by utilising its network and providing technical advice pertaining to the use of satellite data. Wageningen University & Research, several water authorities and Rijkswaterstaat have been involved in the project since its inception. The Sectoroverleg Droogte, which includes representatives from the Ministry, the agricultural sector and managers of large areas of land, provides periodical feedback.